Crudely approximating the functional harmony by simply counting axis colors
hsjoihs 2026-06-14
TL;DR
I propose method of color-counting, a very crude yet mildly useful method of assigning labels “T” /
“S” / “D” to chords. It seeks to somewhat approximate the traditional tonic/subdominant/dominant terminology used in the functional harmony, but prioritizes symmetry over practicality.
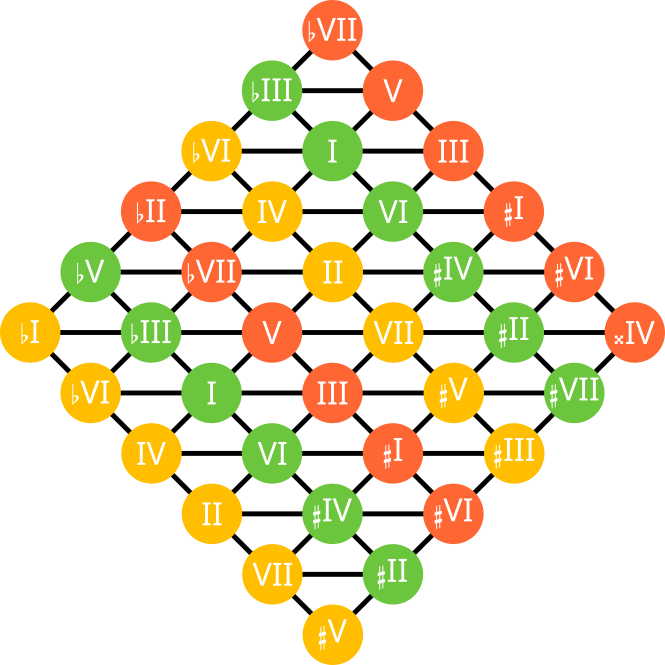
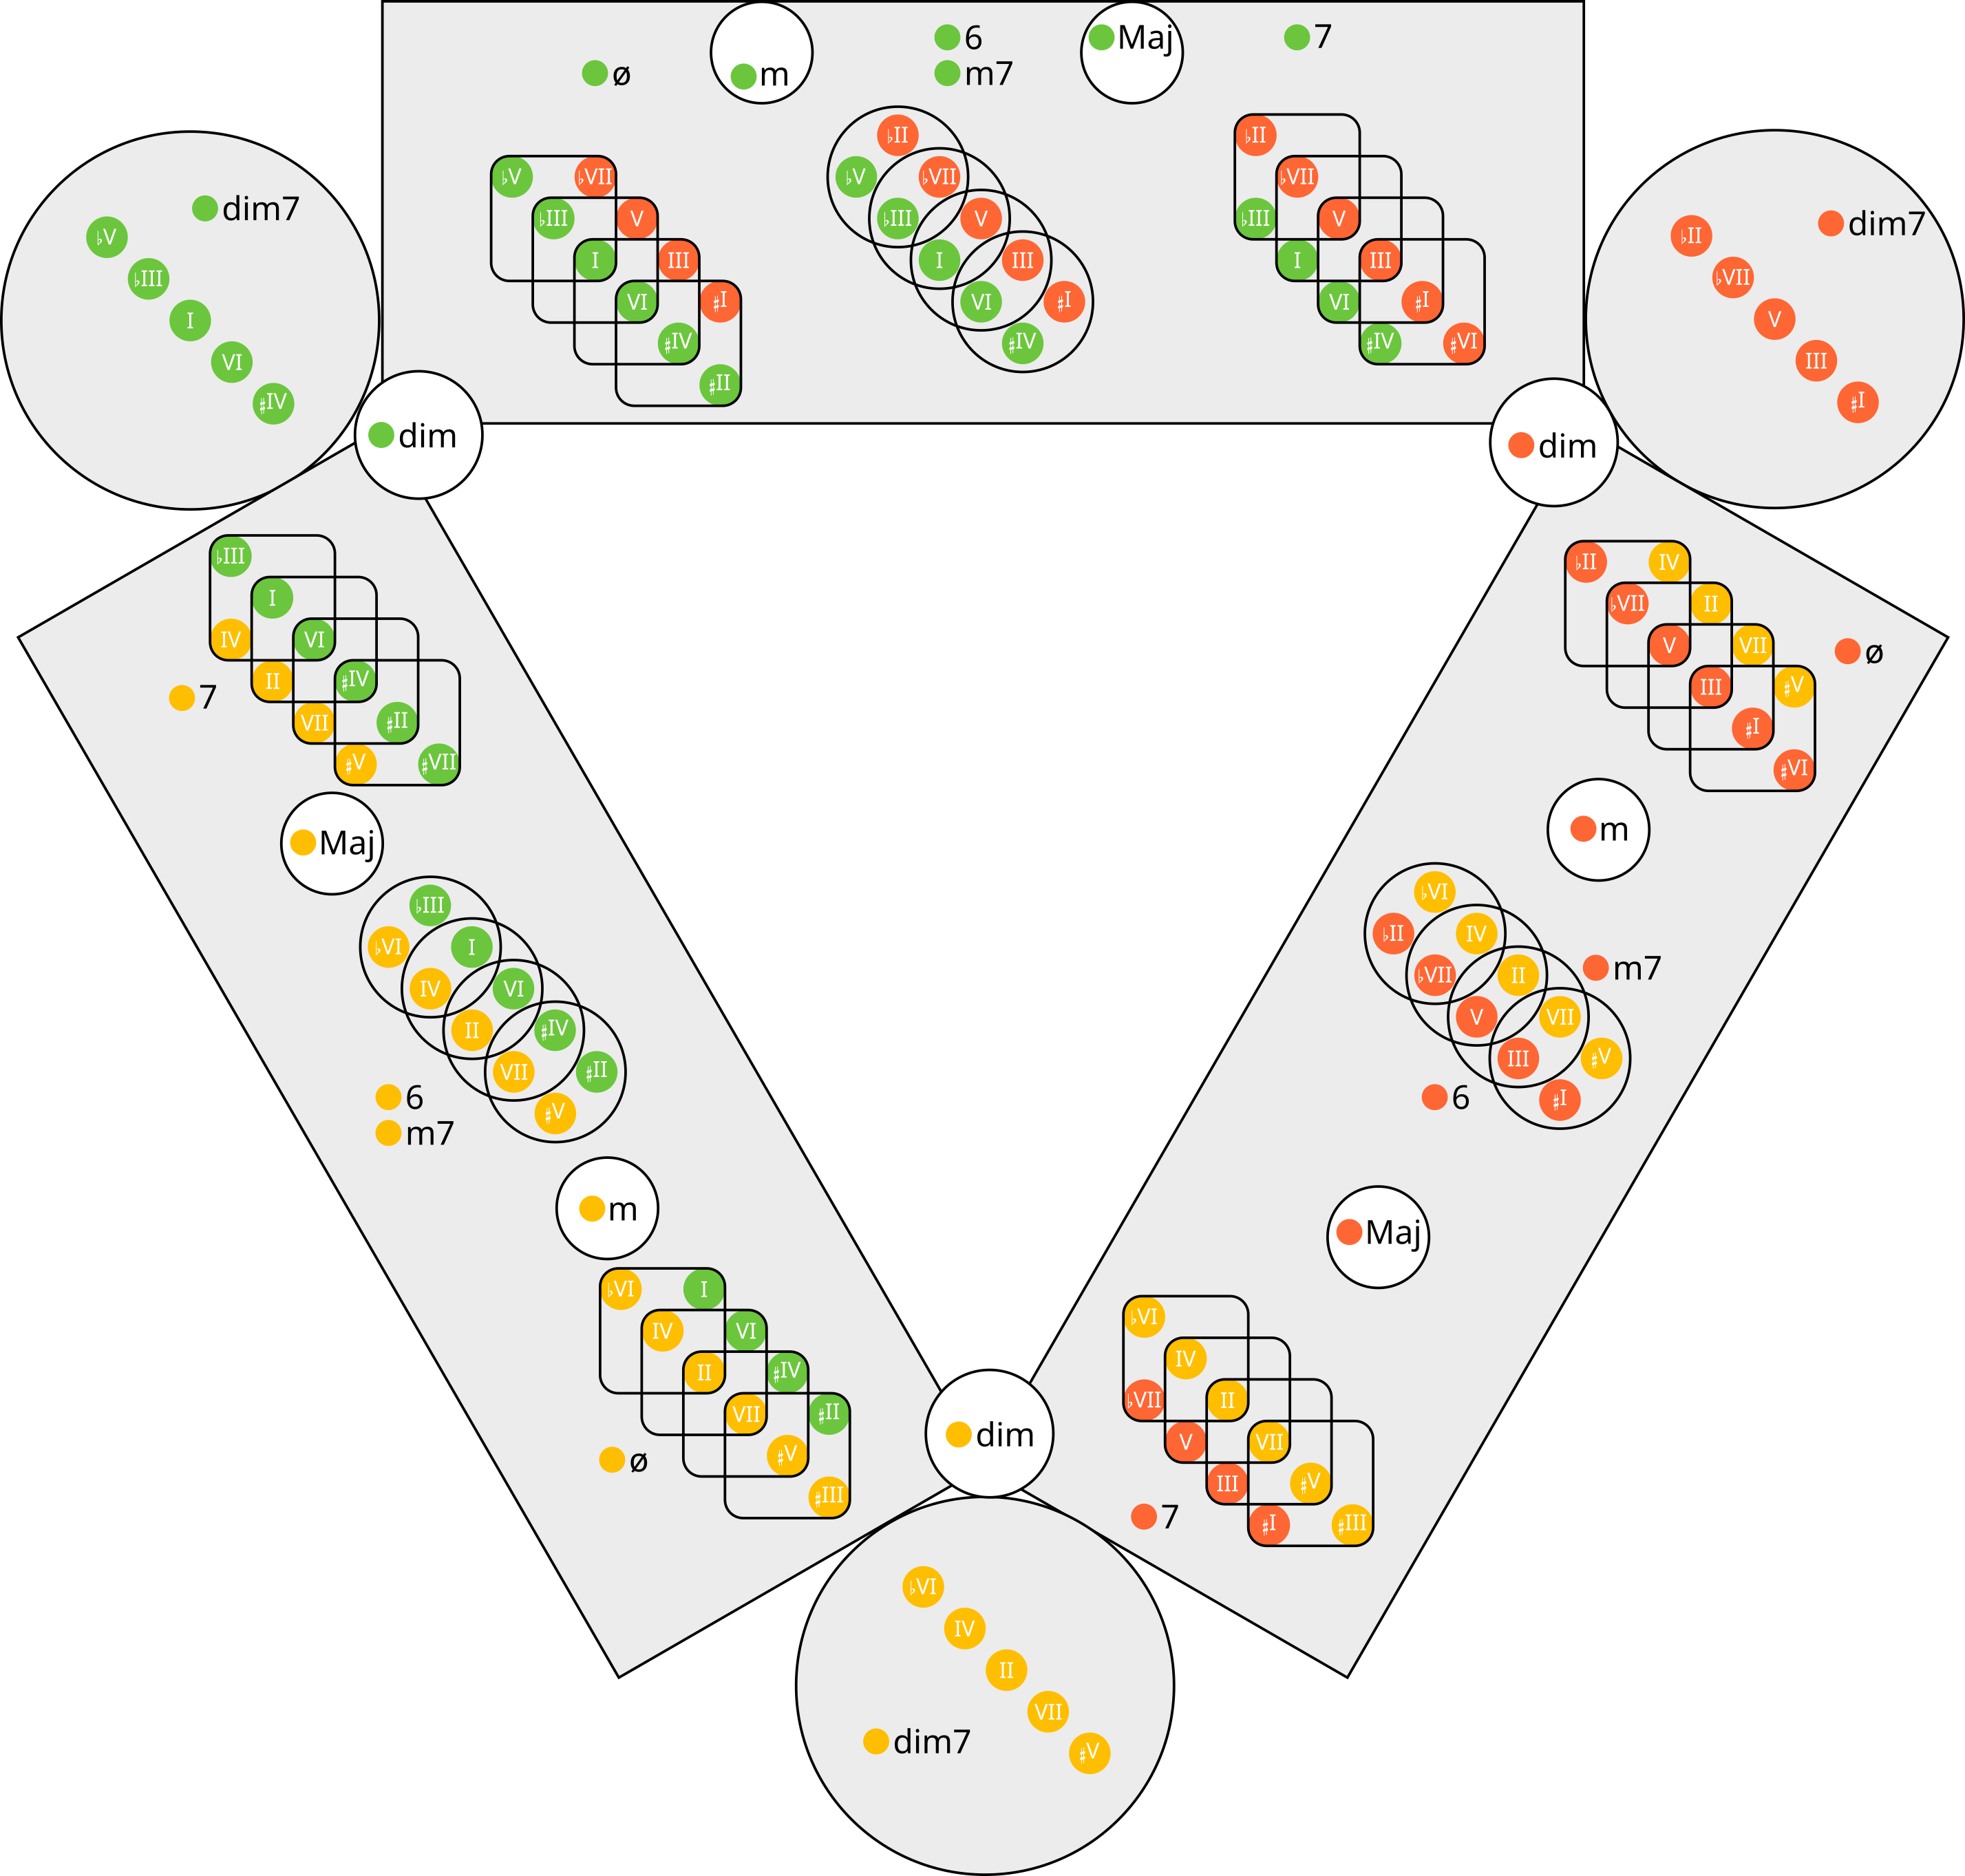
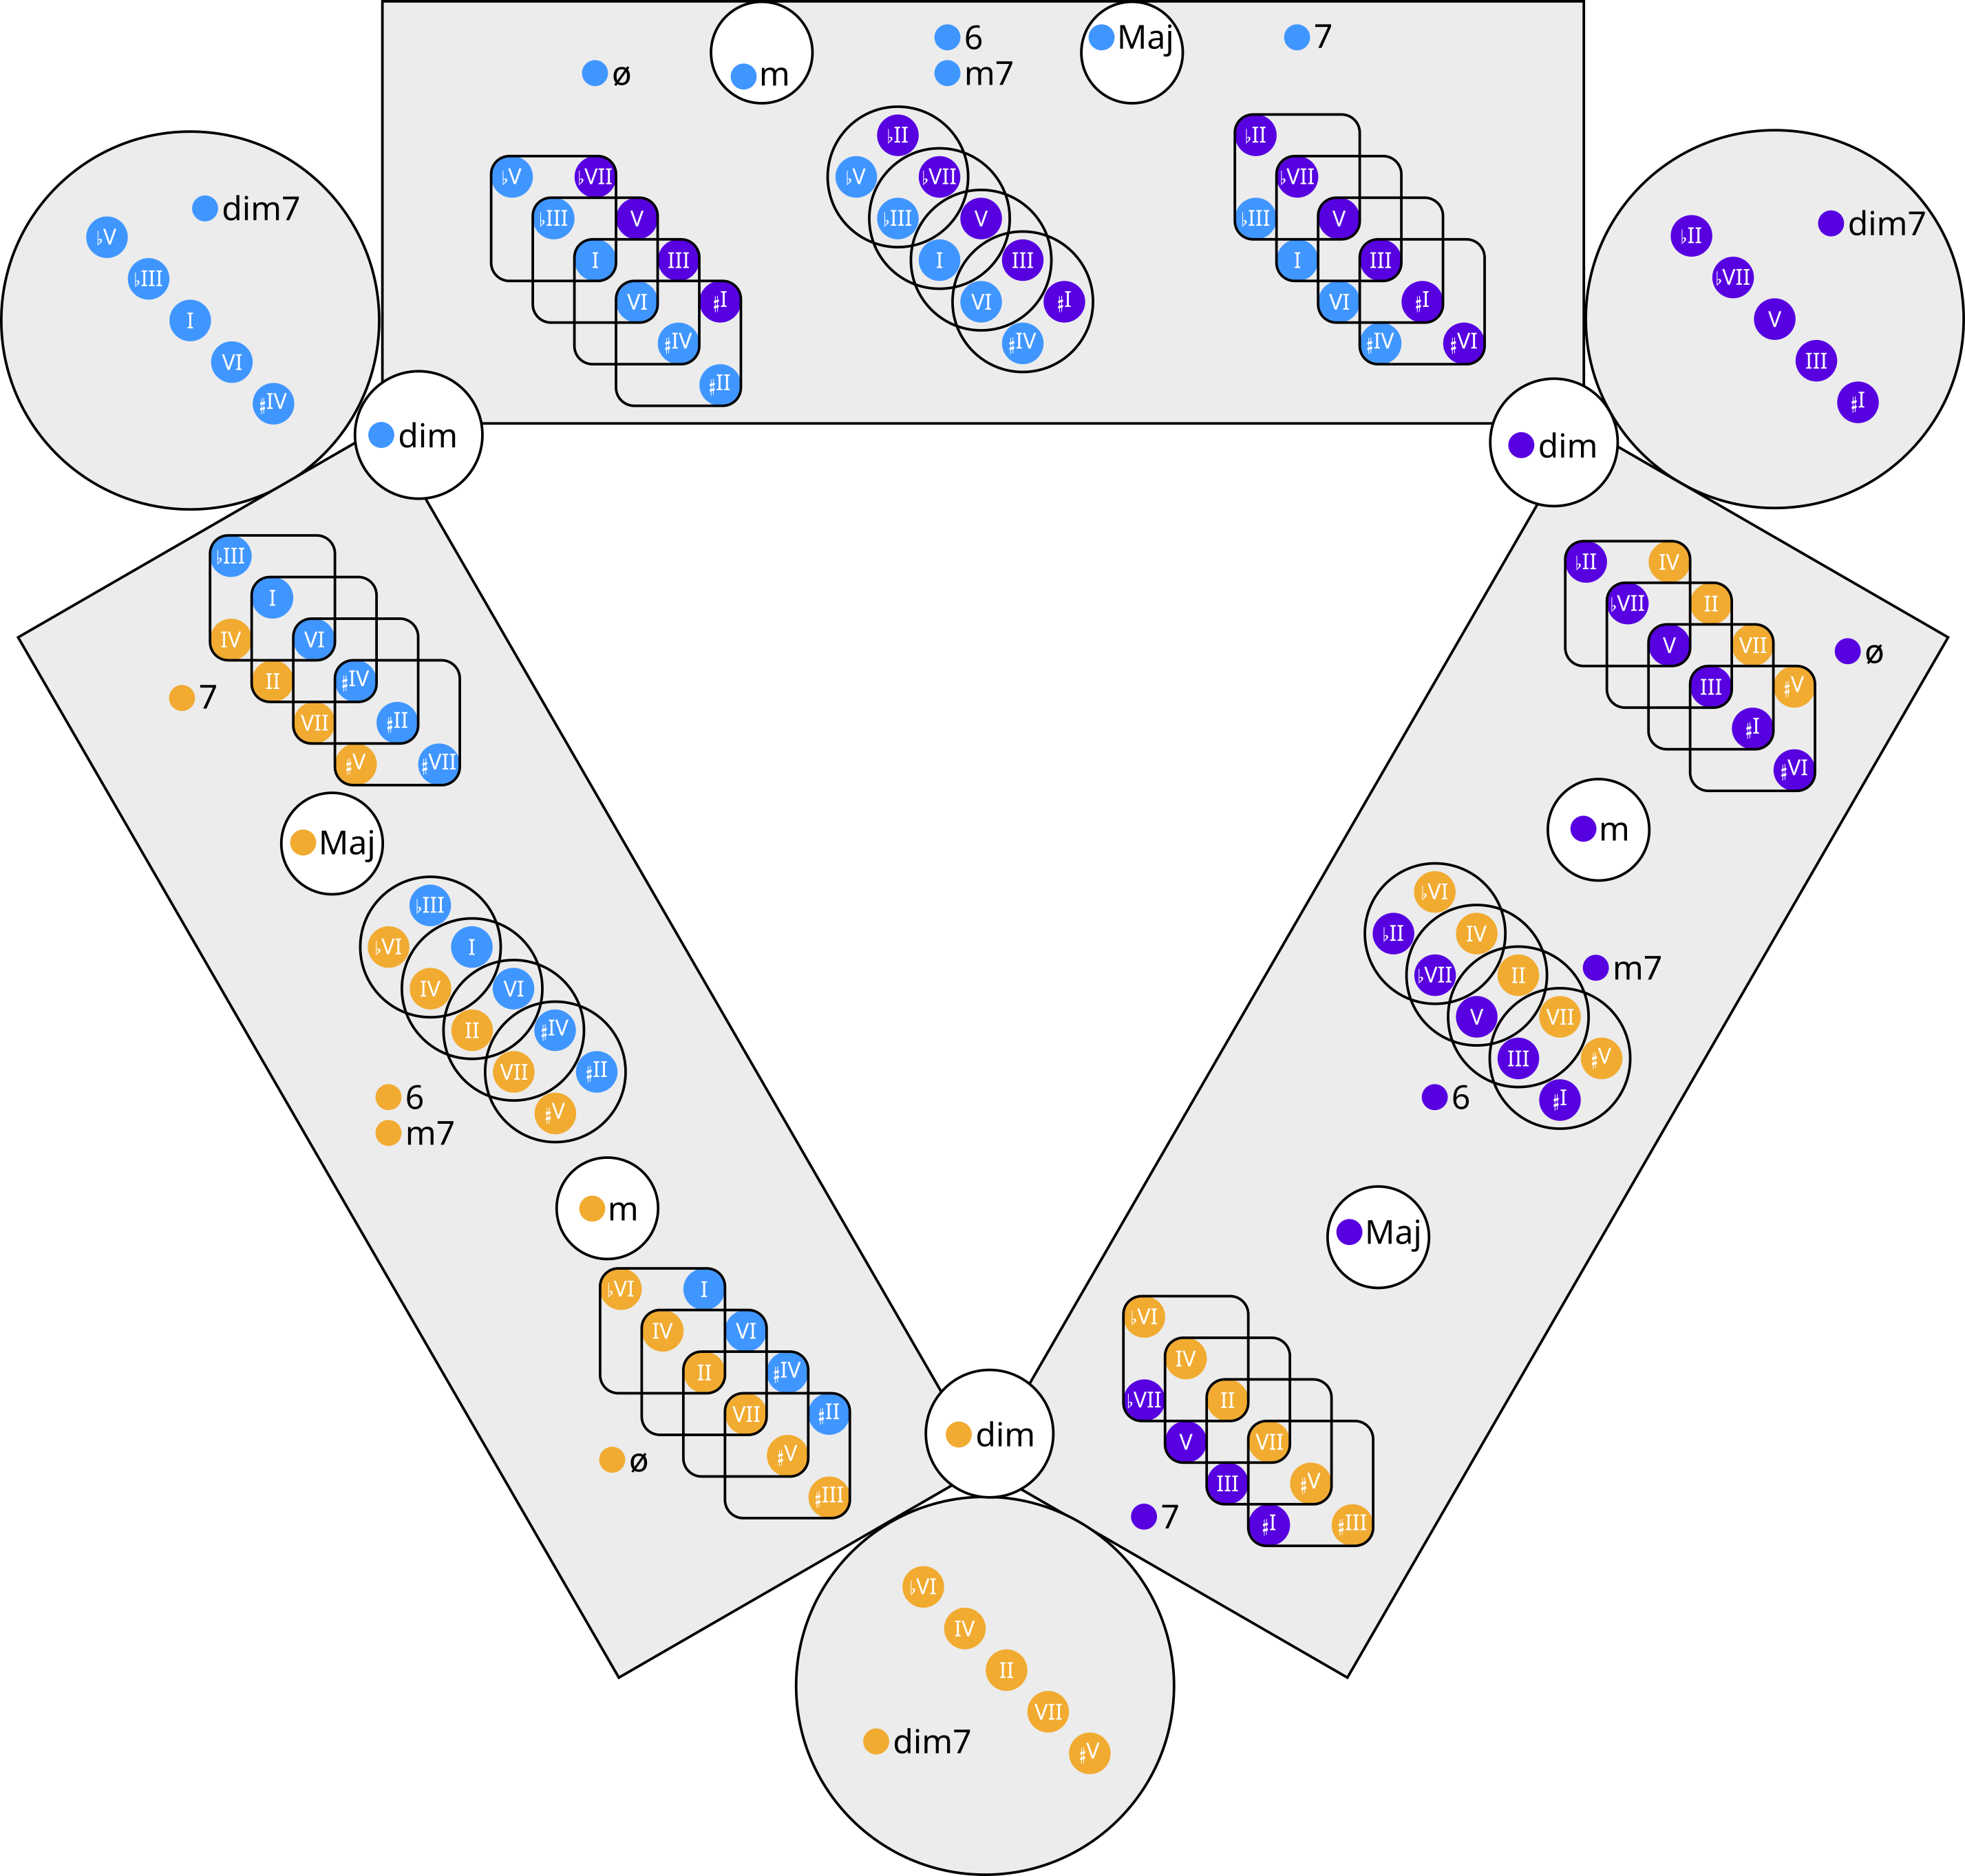
Using the following color scheme (three sets of diminished-7th chords), color all the notes in the chord.
t
♯IV, VI, I, ♭III
s
VII, II, IV, ♭VI
d
♯I, III, V, ♭VII
For instance, A7 in the key of C (either major or minor: the coloring is agnostic to changes in minor third) has A (VI), C♯ (♯I), E (III) and G (V) as its chord notes. Hence this chord has 1 small t and 3 small ds.
Pick all the pairs of two colors, and judge by the following table:
t + s
s + d
d + t
0t
1t
2t
3t
4t
0s
S|T
S
1s
S
S
X
2s
S
S
X
X
3s
D|S
D|S
X
X
X
4s
D
X
X
X
X
0s
1s
2s
3s
4s
0d
D|S
D
1d
D
D
X
2d
D
D
X
X
3d
T|D
T|D
X
X
X
4d
T
X
X
X
X
0d
1d
2d
3d
4d
0t
T|D
T
1t
T
T
X
2t
T
T
X
X
3t
S|T
S|T
X
X
X
4t
S
X
X
X
X
(X = unjudgeable)
For instance, 3 small ds plus 1 small t is a Big T, so we can see that A7 in the key of C is a Big T.
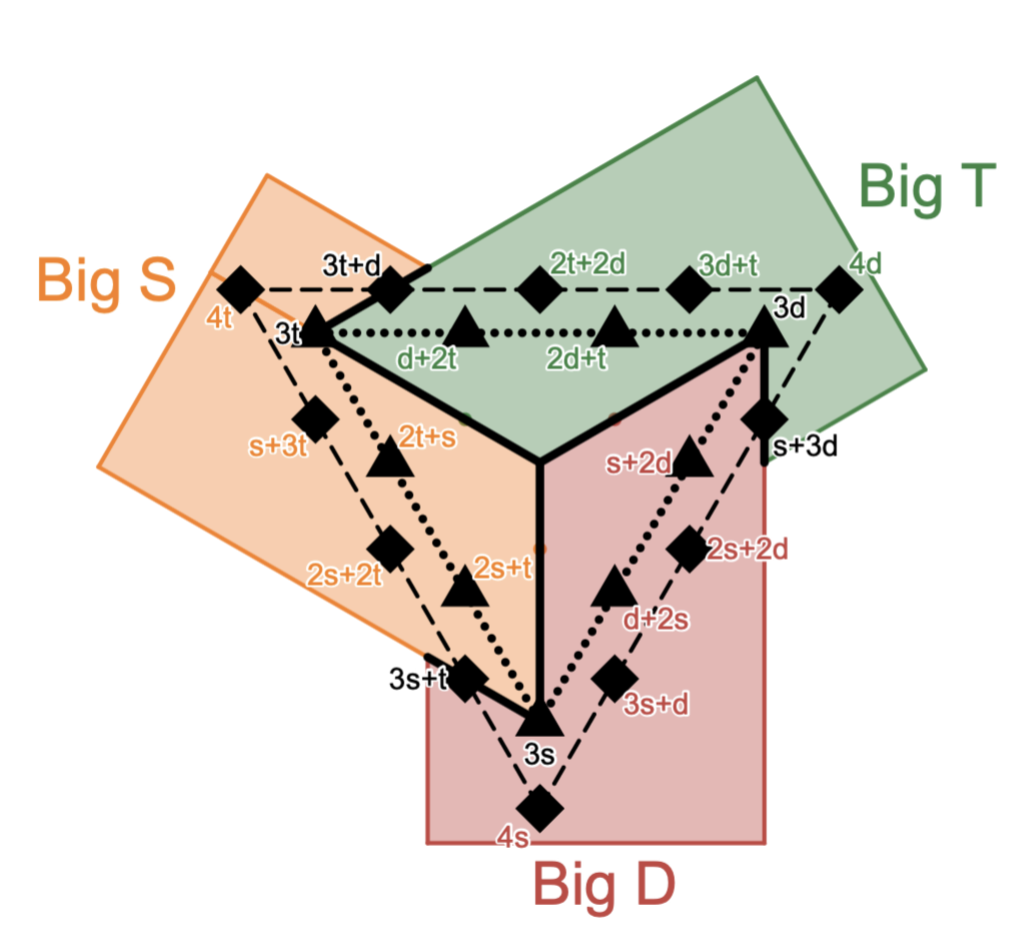
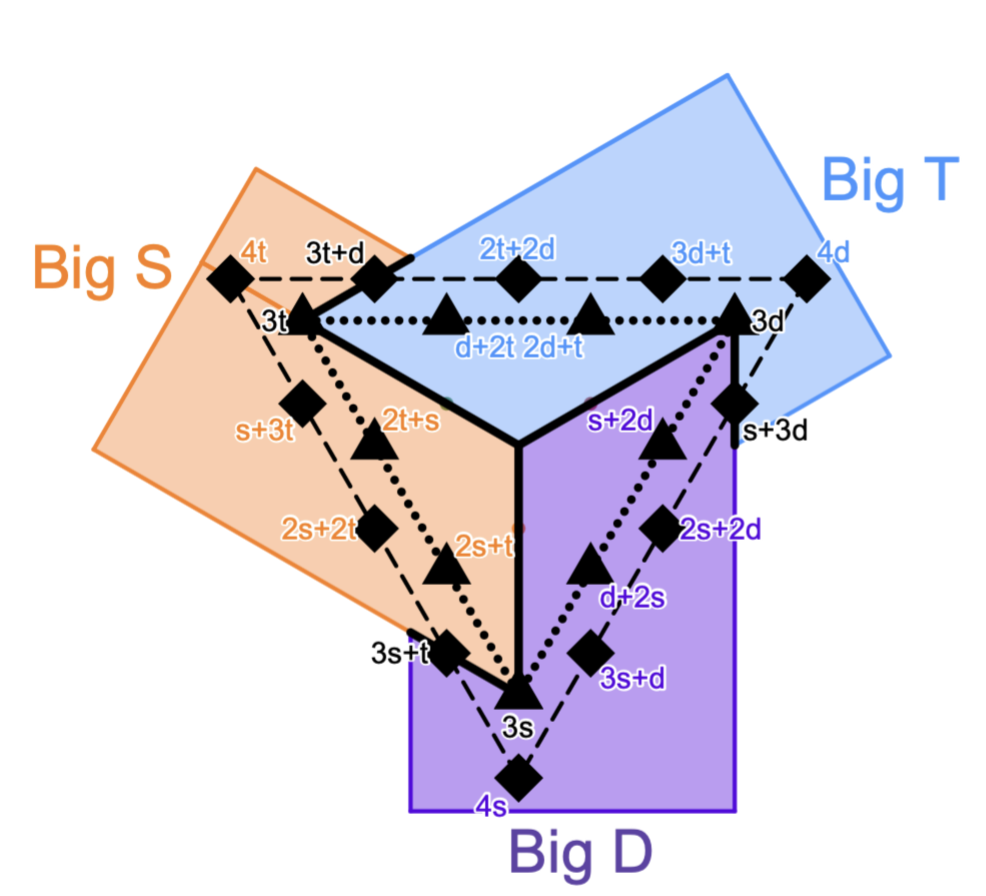
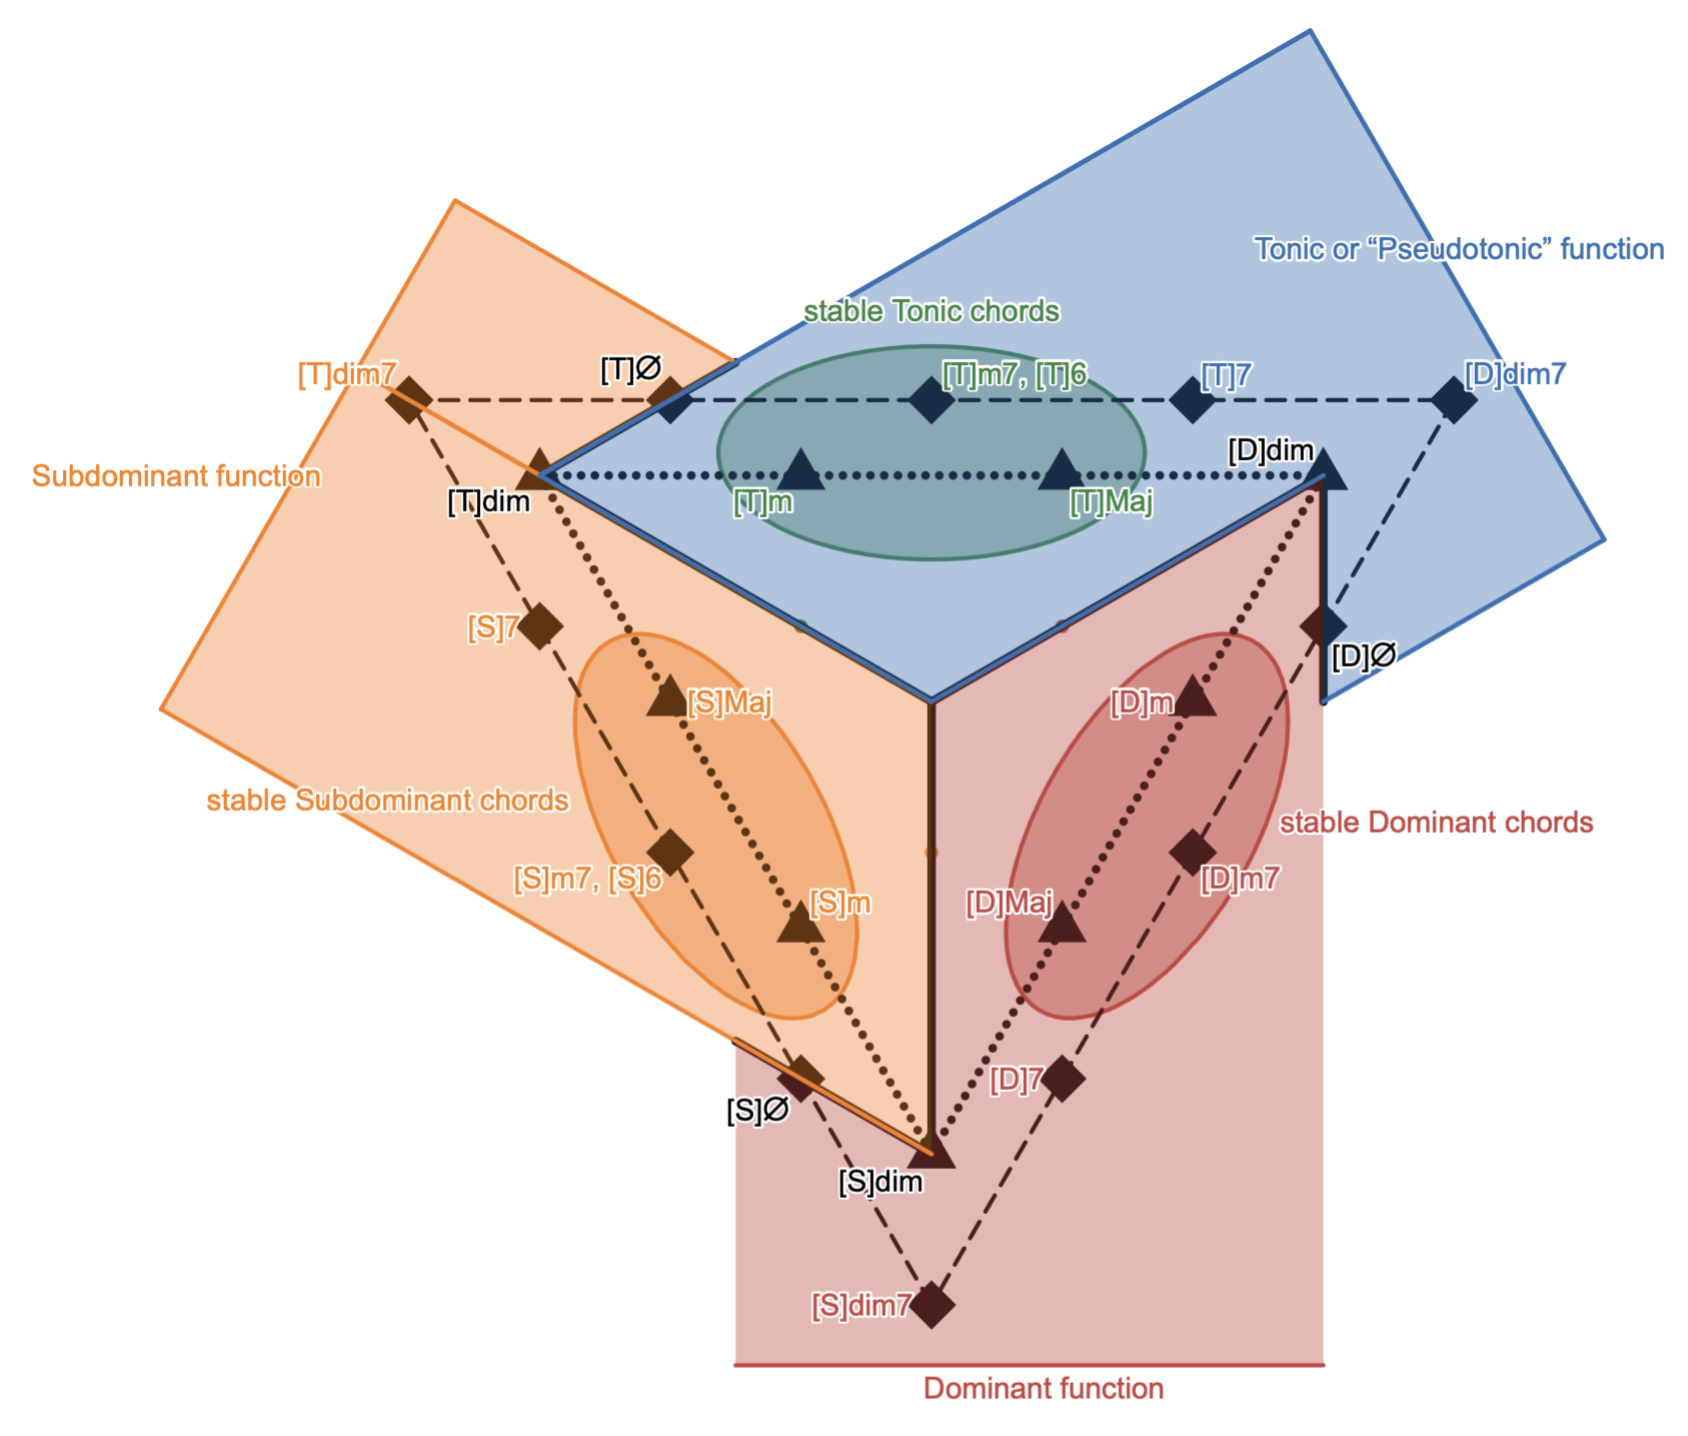
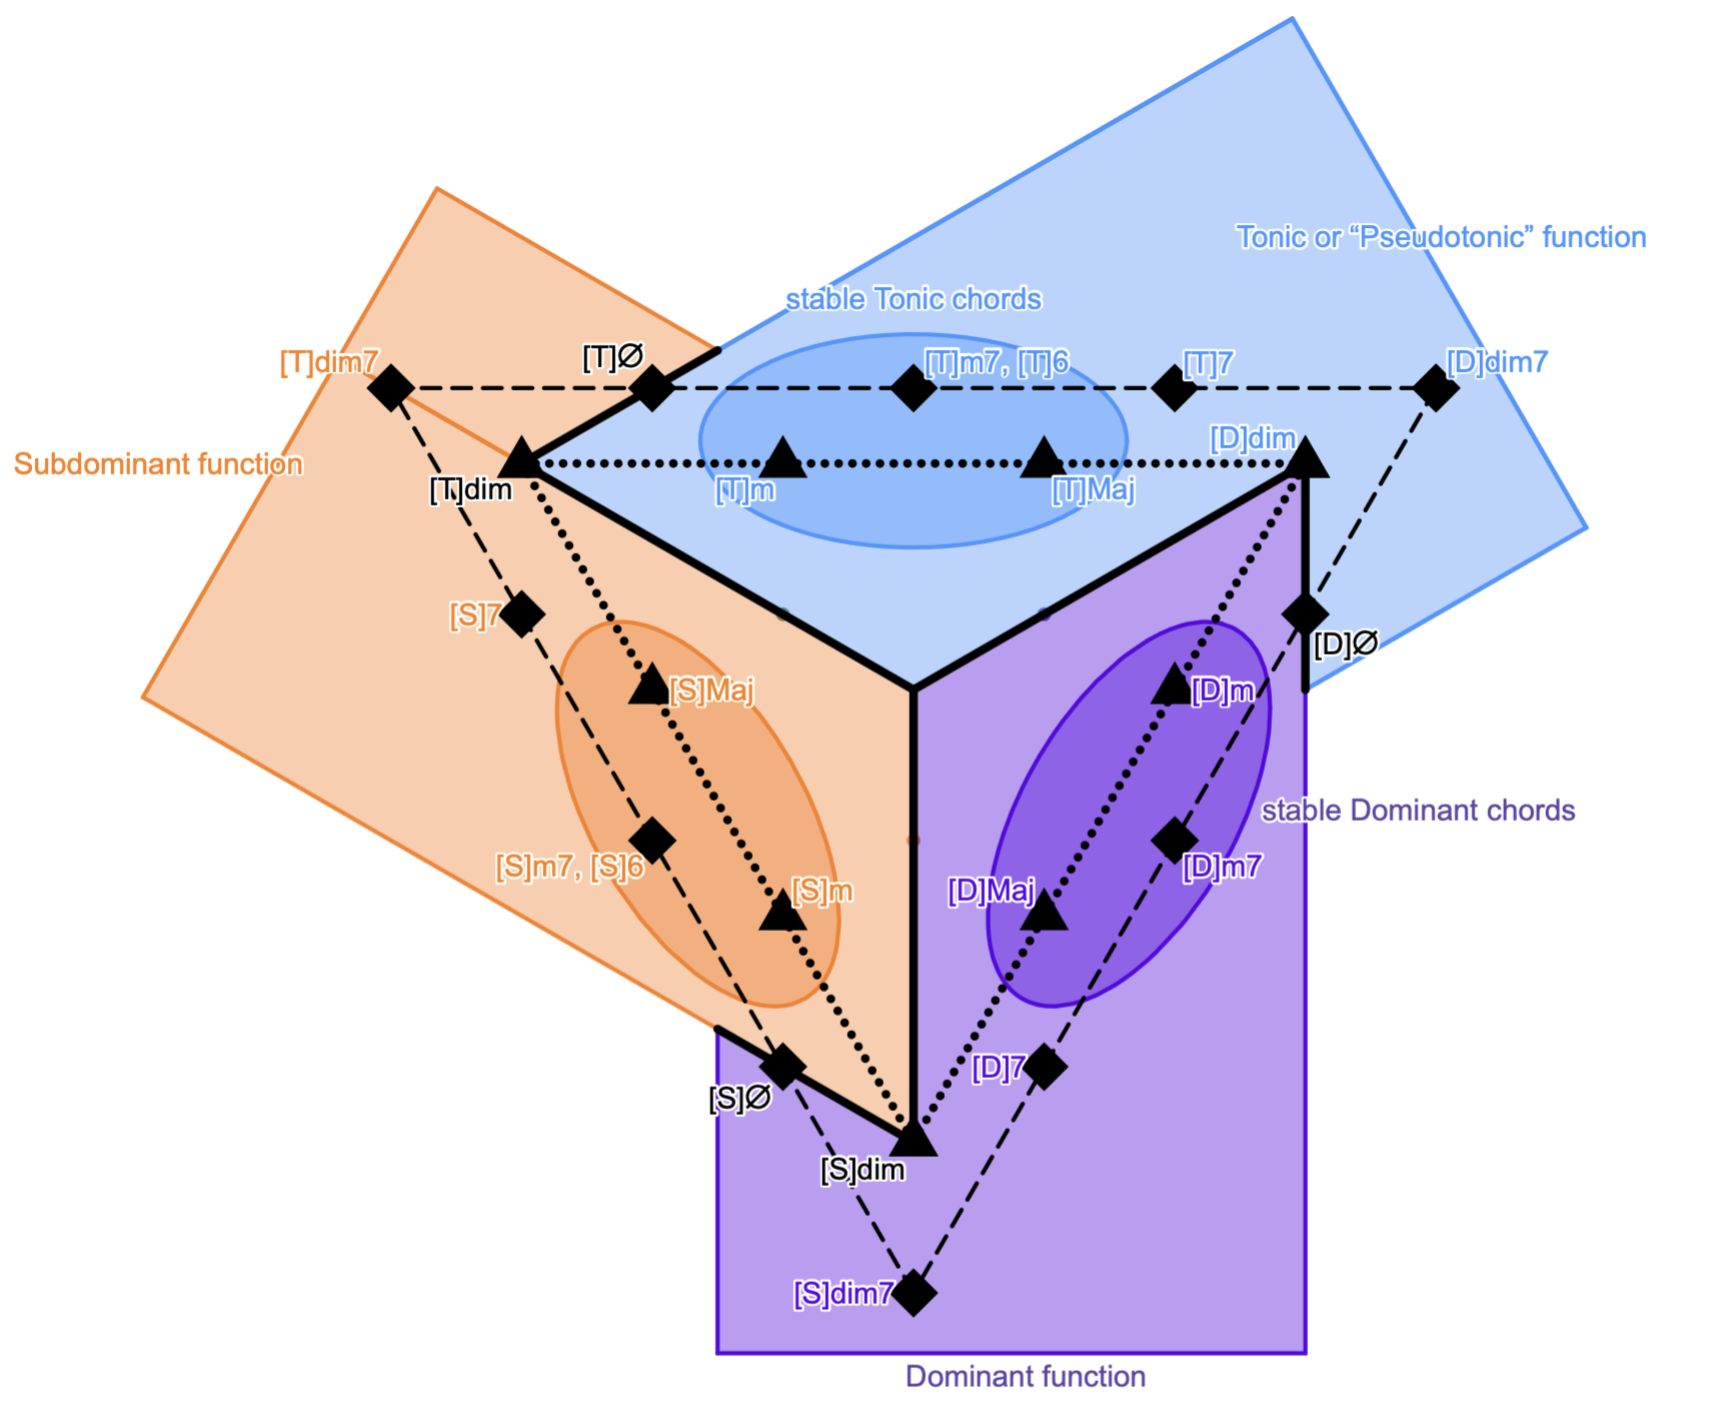
Alternatively, look at the following diagram.
That's it!
Design
I wanted a way of very crudely assigning harmonic
functions to chords. I looked into Ernő Lendvai's axis system, where the twelve tones of the chromatic
scale are grouped into three sets.
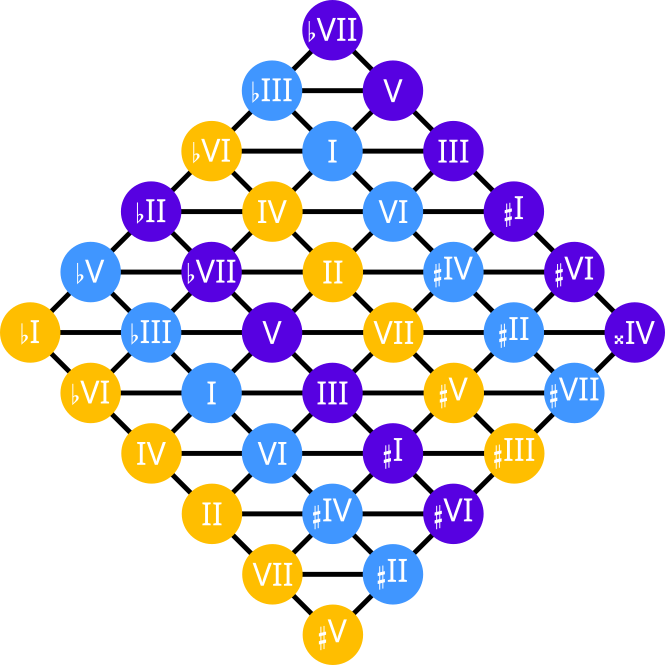
The structure is three-fold symmetric over the twelve-tone equal temperament:
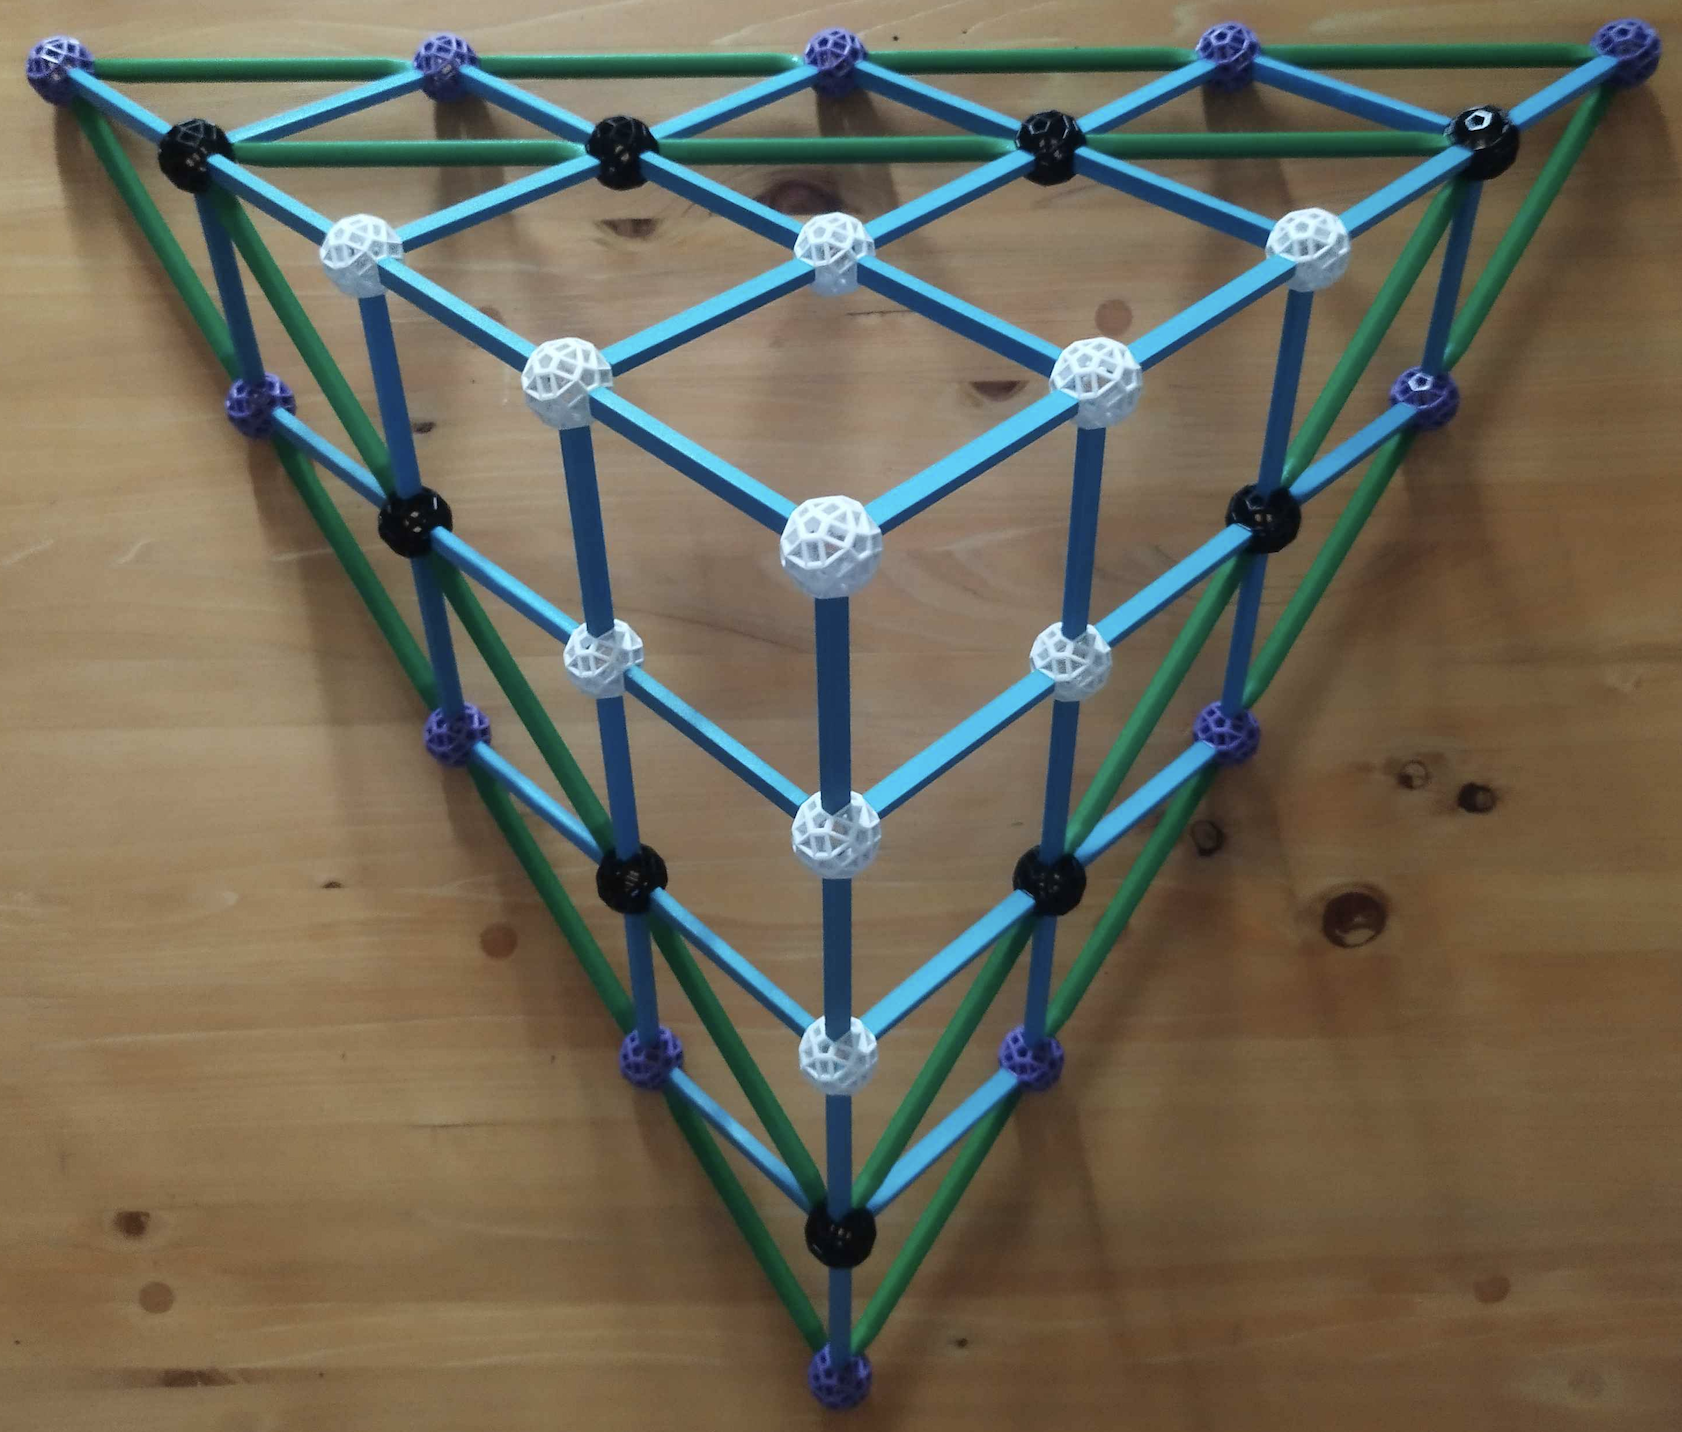
Then, starting from the origin (at the center) and moving along each axis (pun intended), we can plot the chords on this grid:
Flaws
This method is a massive overgeneralization; for instance, it ignores the difference between C-E-G and E-F#-G. Hence I did not claim that what I am talking about is “tonic”, “subdominant” or “dominant”